Tech Stack
Before / After
Before
Dashboard-only BIMeasures live inside a .pbix binary nobody can review.
No tests run before the data reaches a chart.
No API layer — the numbers can't be reused downstream.
'Trust me it's right' instead of 'here's the file that proves it'.
After
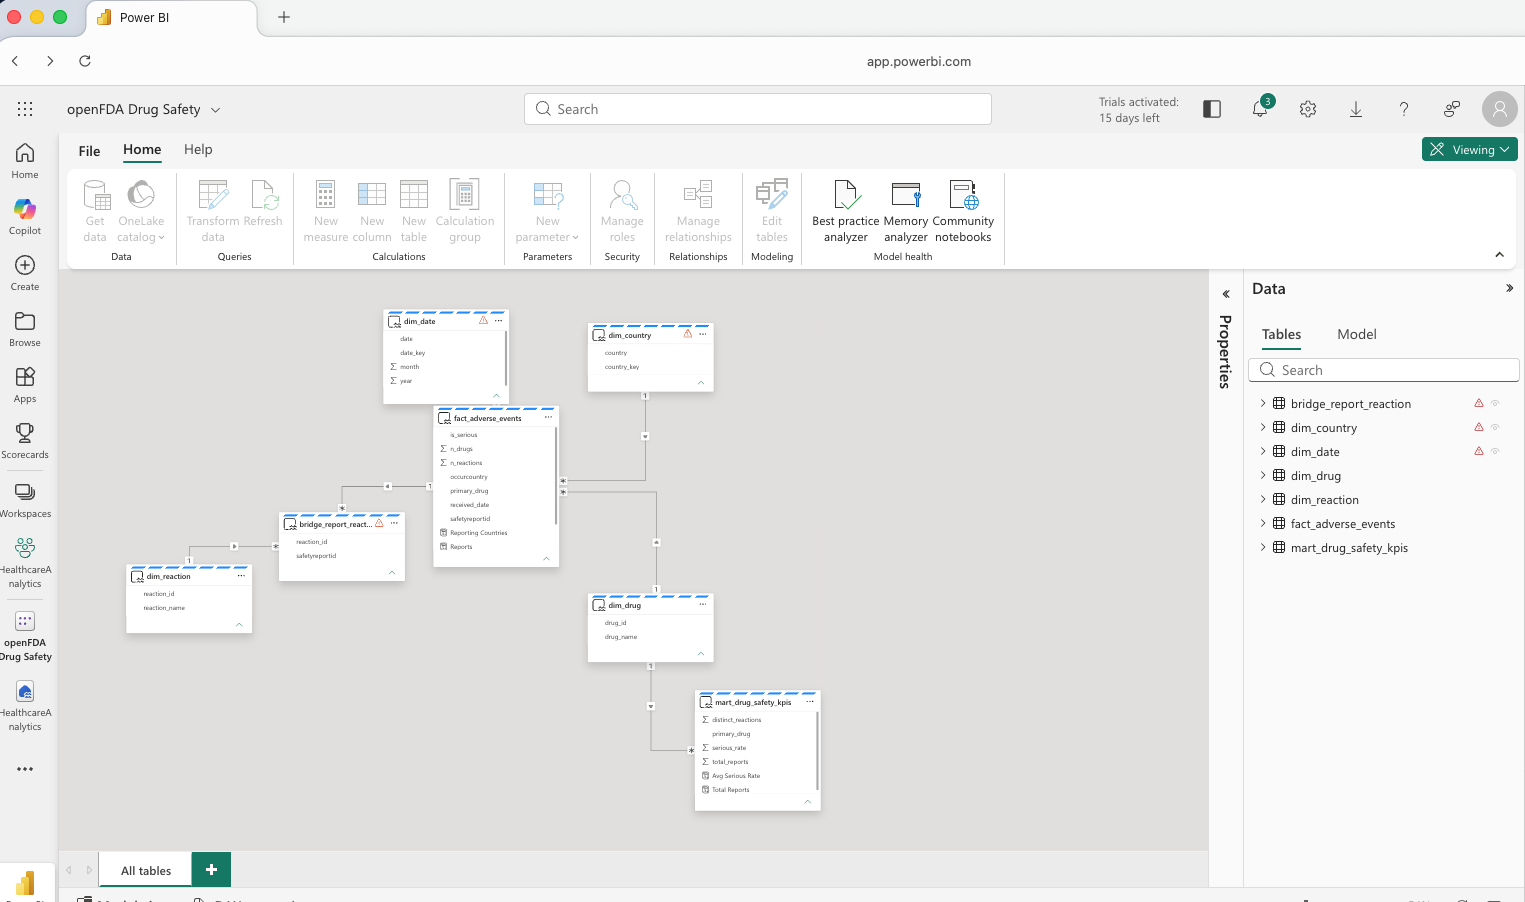
Code-first Fabric stackPower BI Ships From CodeThe Direct Lake semantic model and the report (openFDA Drug Safety Report, id ef468dc5, 3 visuals) deploy through the Fabric REST API — not by clicking through Power BI Desktop.
Questions Return In SecondsReal DAX runs through the Power BI engine: drug leaderboard p50 1.15s, KPI card p50 0.66s — every query under 5s, measured (proofs/powerbi_dax_latency.json).
Fabric Can't Quietly Change The Truth · MEASUREDfact + dim_drug/reaction + mart counts reconcile GCP ↔ Fabric exactly (3,000 = 3,000); the openFDA fact contract is the same one GCP and AWS load.
Rendered Screenshot Has A Cap · BOUNDARYExportToFile (report → PNG via API) is blocked on the free FTL trial, so the native screenshot needs a logged-in browser; the published chart is generated from the same DAX data.